Querying and visualizing the data
The main goal of PHYLOViZ is to provide a data visualization tool for overlaying accessory data on the data analysis algorithms result. This allows to test the method’s adequacy to the data, or the proposal of novel hypothesis. This section will explain the basics on how this can be achieved in our software. The user can query the data using regular expressions, or simply manually selecting the desired fields from the table or, even just use the checkboxes in the tree view. Using your dataset and this instructions you should be able to create visualizations similar to the ones found in the PHYLOViZ website.
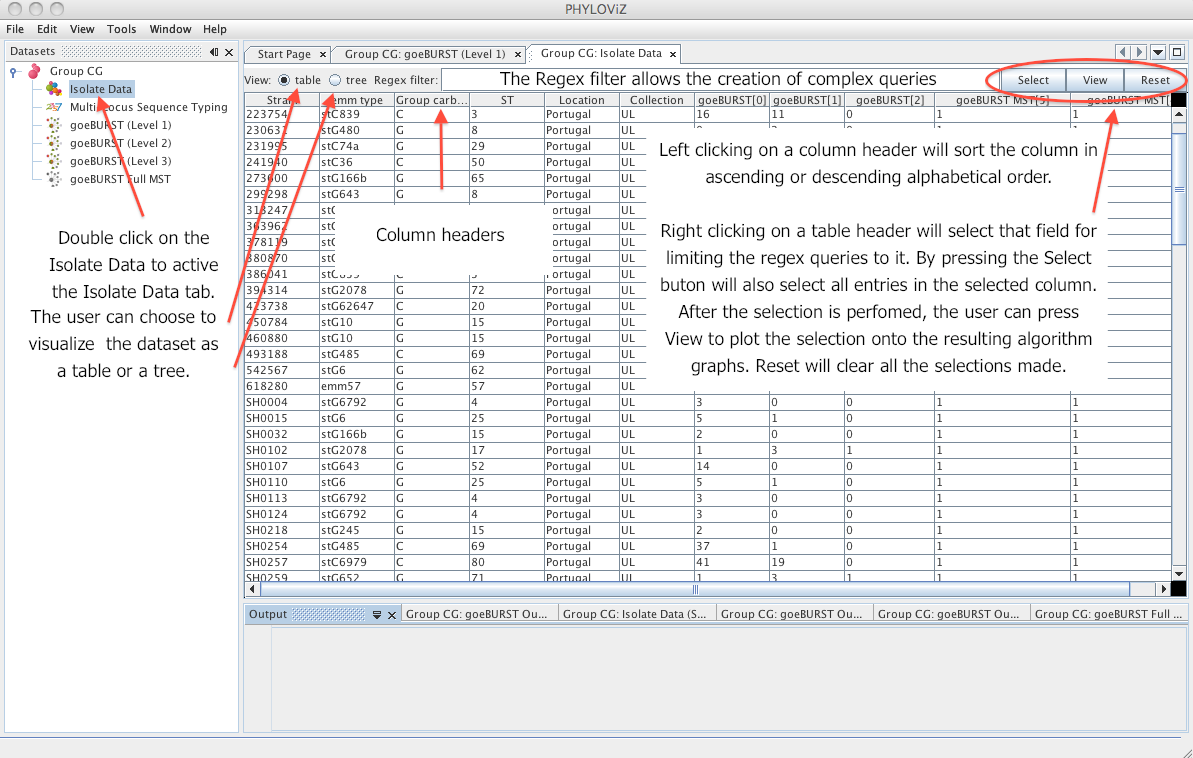
The isolate data tab
The Isolate Data tab is displayed by double clicking on the Isolate Data on the Dataset tree. The following screenshot resumes the basic functionality of the display on the table view.
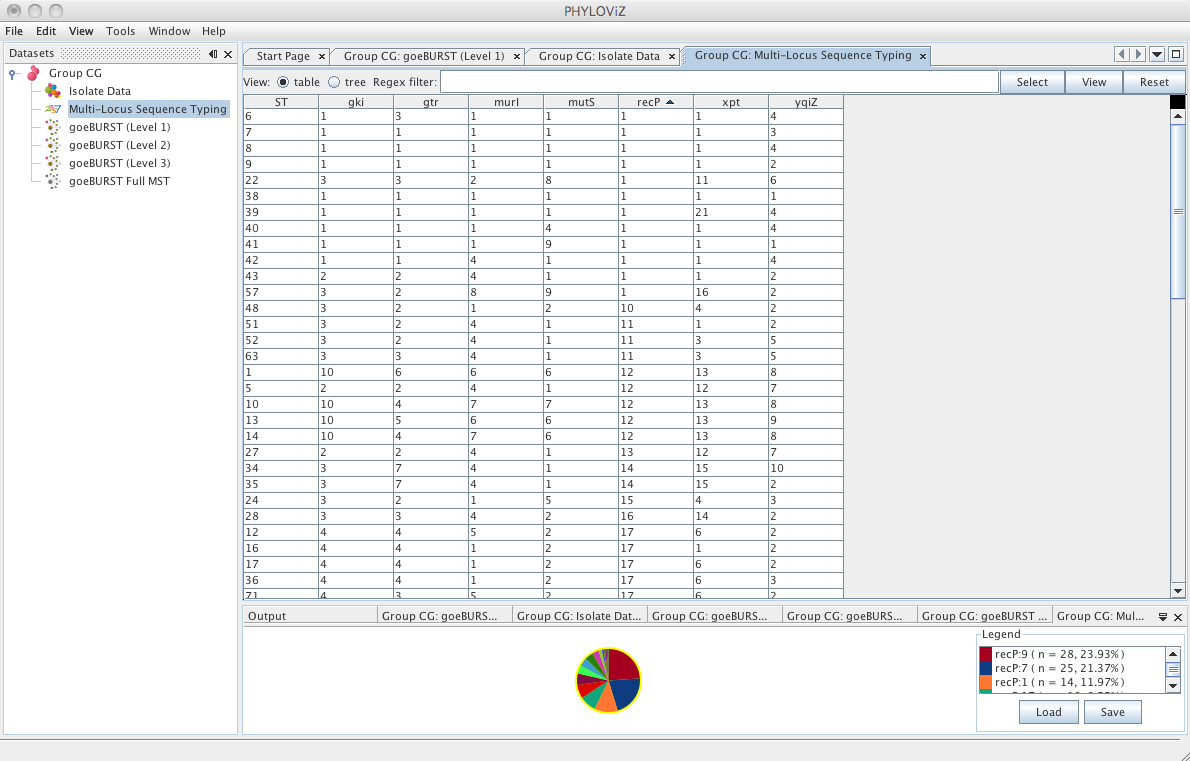
The typing data tab
The Typing Data tab contains the allelic profiles loaded in the dataset. The name of displayed on the tab, and on the Dataset tree, is the name of the selected method during the Load Dataset procedure. The user can also query, select and visualize the data of the allelic profiles, similarly to operations describe in the Isolate Data tab.
Regular expression primer
Some basic regular expressions that can be used in PHYLOViZ. For more complex expressions there are extensive tutorials on regular expressions online. Just search Regular Expression or regex.
.(period mark) - represents any character.[ ](square brackets) - Match anything inside the square brackets for one character position once and only once. Examples:[40]will match any field with4or0;[7-9]will match any field will7,8or9(-is the range separator).^(caret) - Starts with. Ex:^Pwill give you all the fields that start with aP. Inside the square brackets means negation. Example[^a-c]means anything nota,borc.$(dollar sign) - Ends with. Ex.7$will give you all fields that end in a7.?(question mark) - Matches the preceding character 0 or 1 times only. Example:colou?rwill findcolorandcolour.*(asterisk) - Matches the preceding character 0 or more times. Example:tre*would findtree,treadandtrough.+(plus) - Matches the preceding character 1 or more times. Example:tre+would findtree,treadbut nottrough.{n}(any integer between brackets) - Matches the preceding character exactly n times. Example:AT[GC]{2}would matchATGC,ATCG,ATGGorATCCbut notATGA.
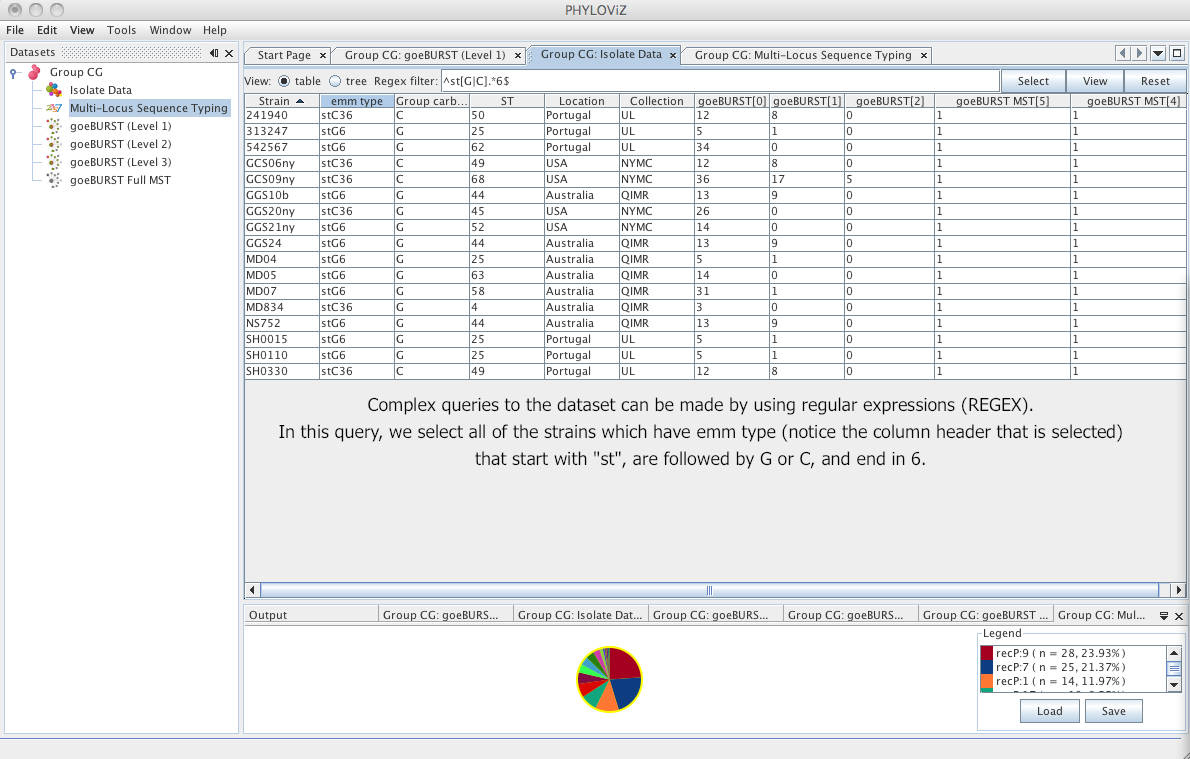
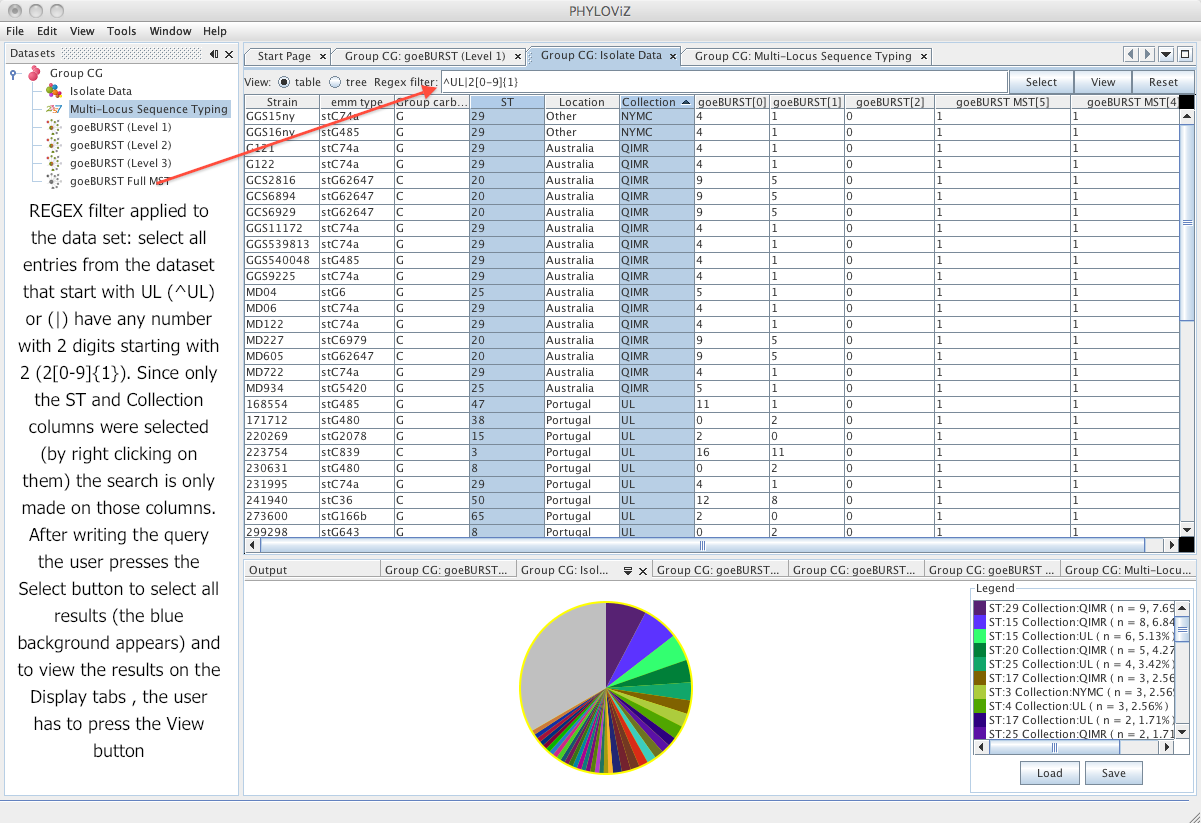
All these operators can be combined to create complex search expressions. For example : ^st[G|C].*6$ would find any field that starts with st followed by a C or a G then as 0 or more characters and ends with a 6. The following screenshot shows the result on the test dataset:
Queries using the table view
In the Table view of the Data tab you can manually select any field you want to represent by left clicking on it. That will automatically display all the entries with the selected value and not only the selected ones. To select multiple fields you can press the CTRL key (or CMD on Mac) while clicking on the desired fields. If you keep the SHIFT key pressed you can select ranges of cells.
You can also automatically select multiple columns by clicking with the right mouse button on the table headers and pressing the Select button.
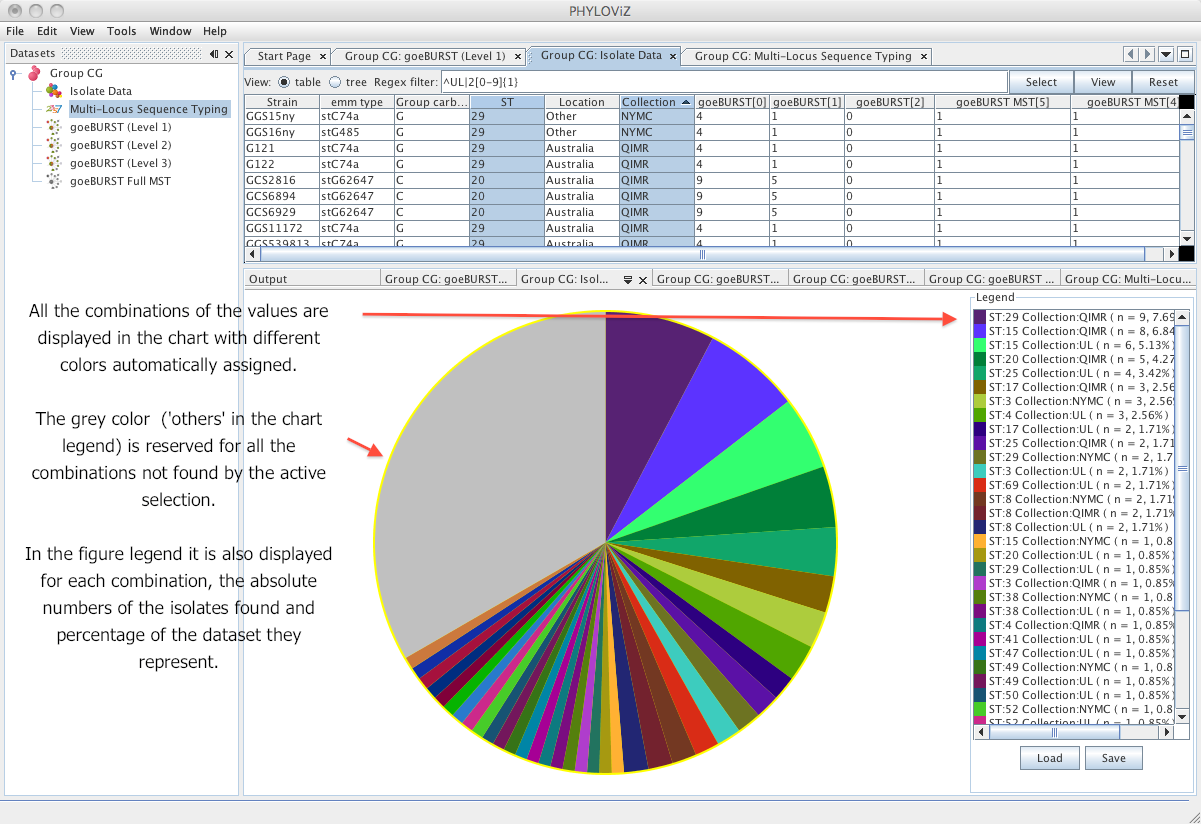
Finally to plot the data on the Display tab, press the View button, after all the desired selections are performed.
Queries using the tree view
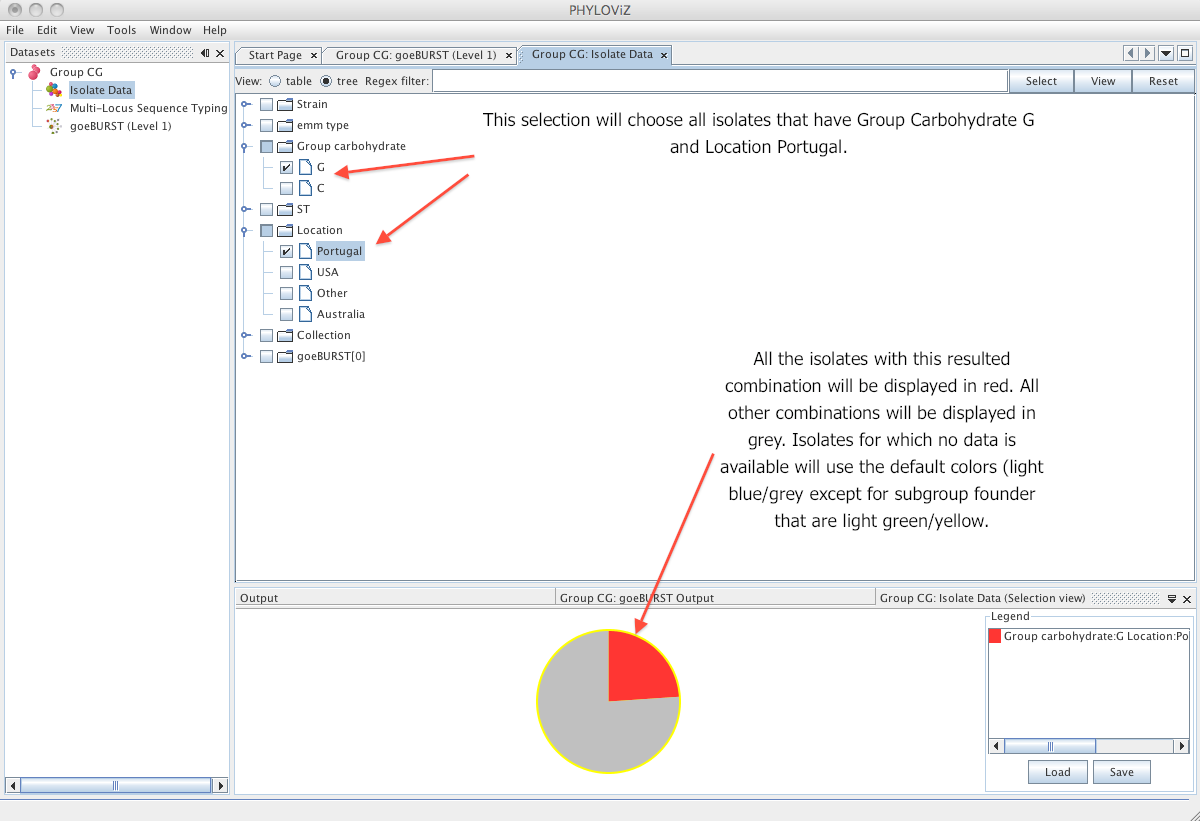
The Tree view offers a faster way to create simple queries. The user can also use the regex filter to search the dataset but all the possibilities for each dataset column are automatically indexed in a tree like manner. By pressing the Select button and switching to Table view the user can see the resulting selection. The users can alternate both views (Table and Tree) at will for creating the selection.
Query examples
- Tree view with selections
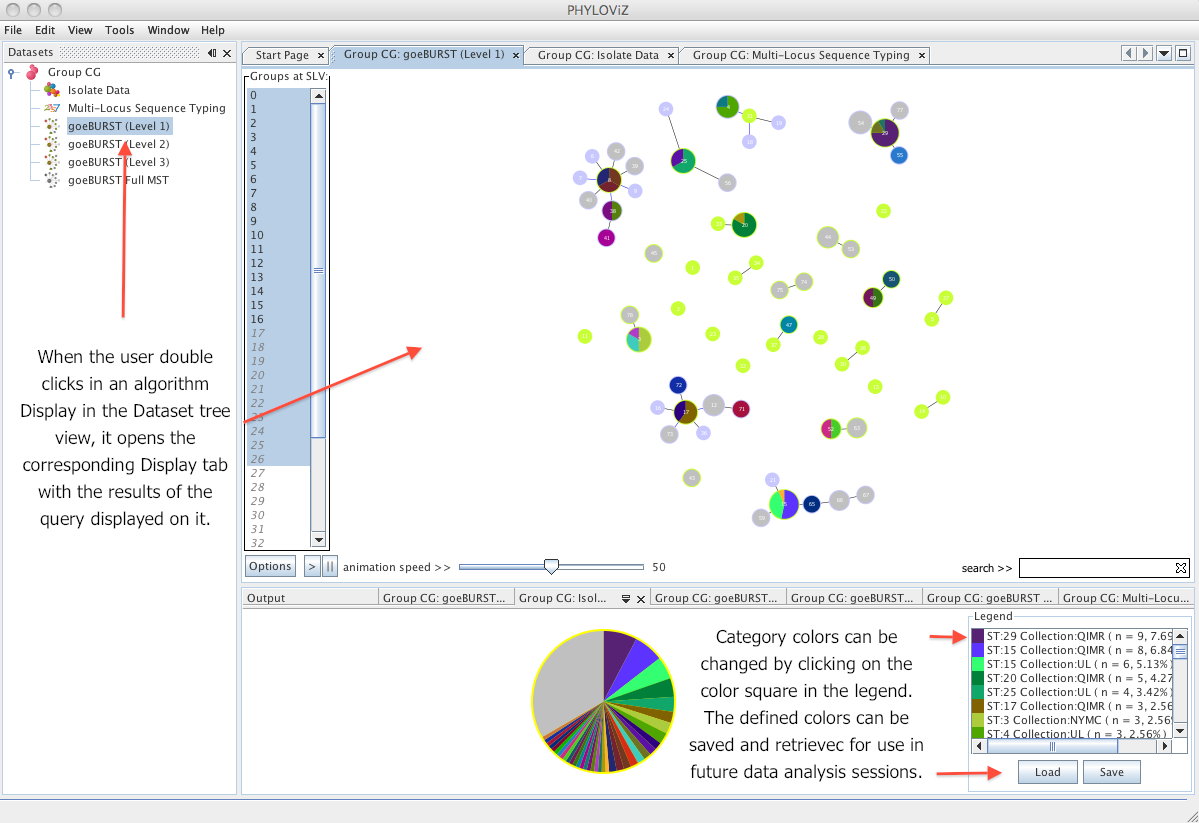
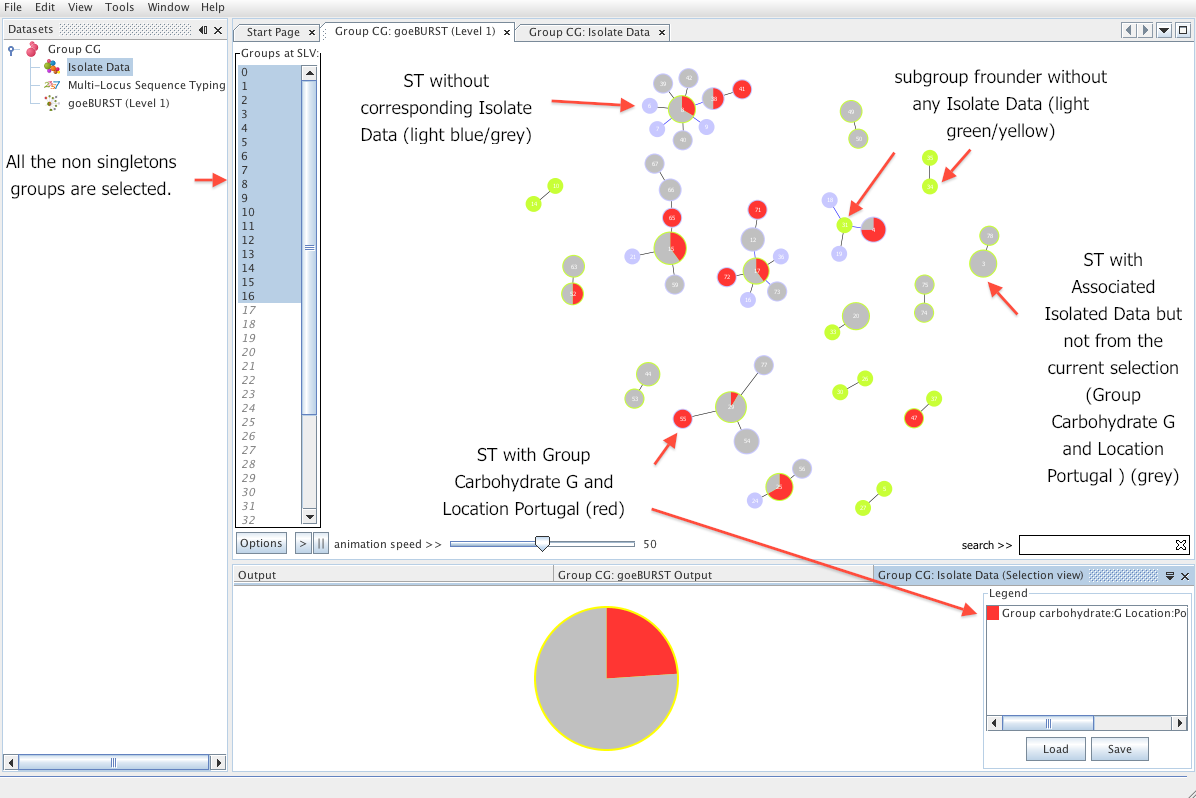
- Queries on the results produced by the goeBURST and goeBURST Full MST algorithm
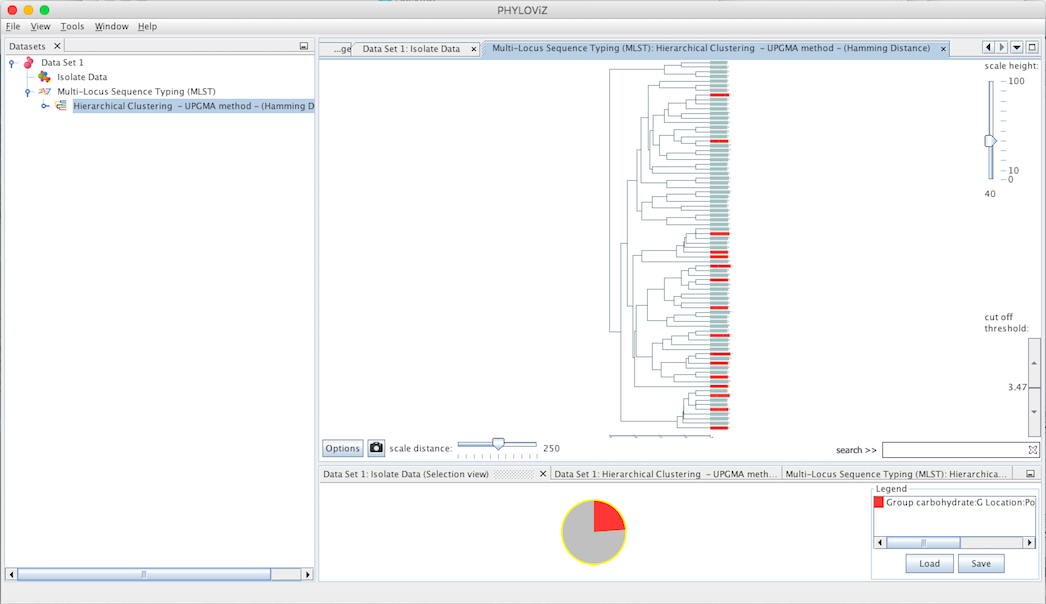
- Queries on the results produced by the Hierarchical Clustering algorithm
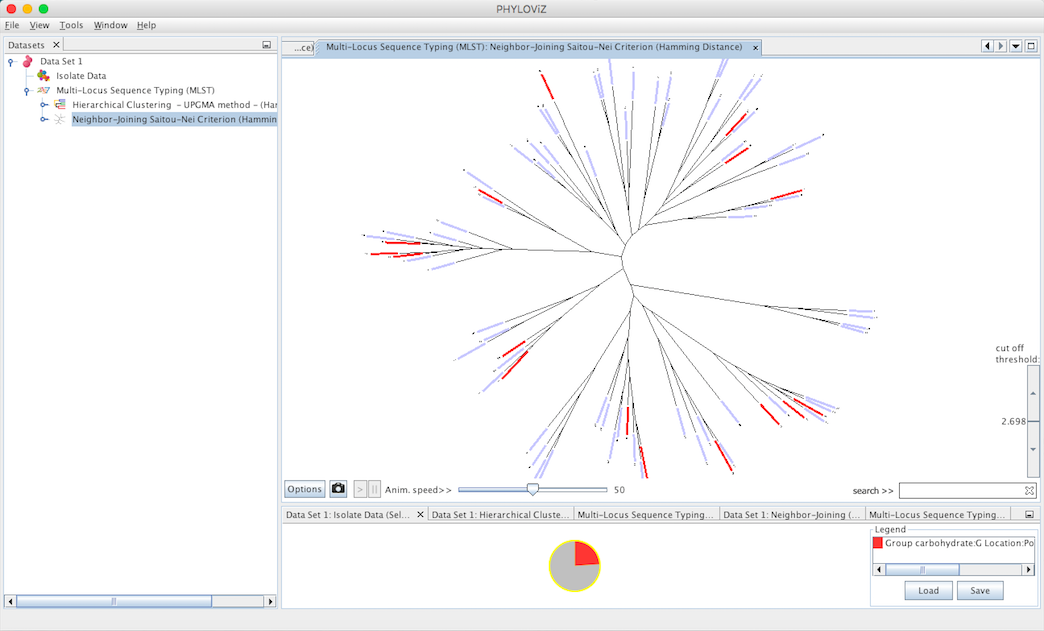
- Queries on the results produced by the Neighbor Joinning algorithm
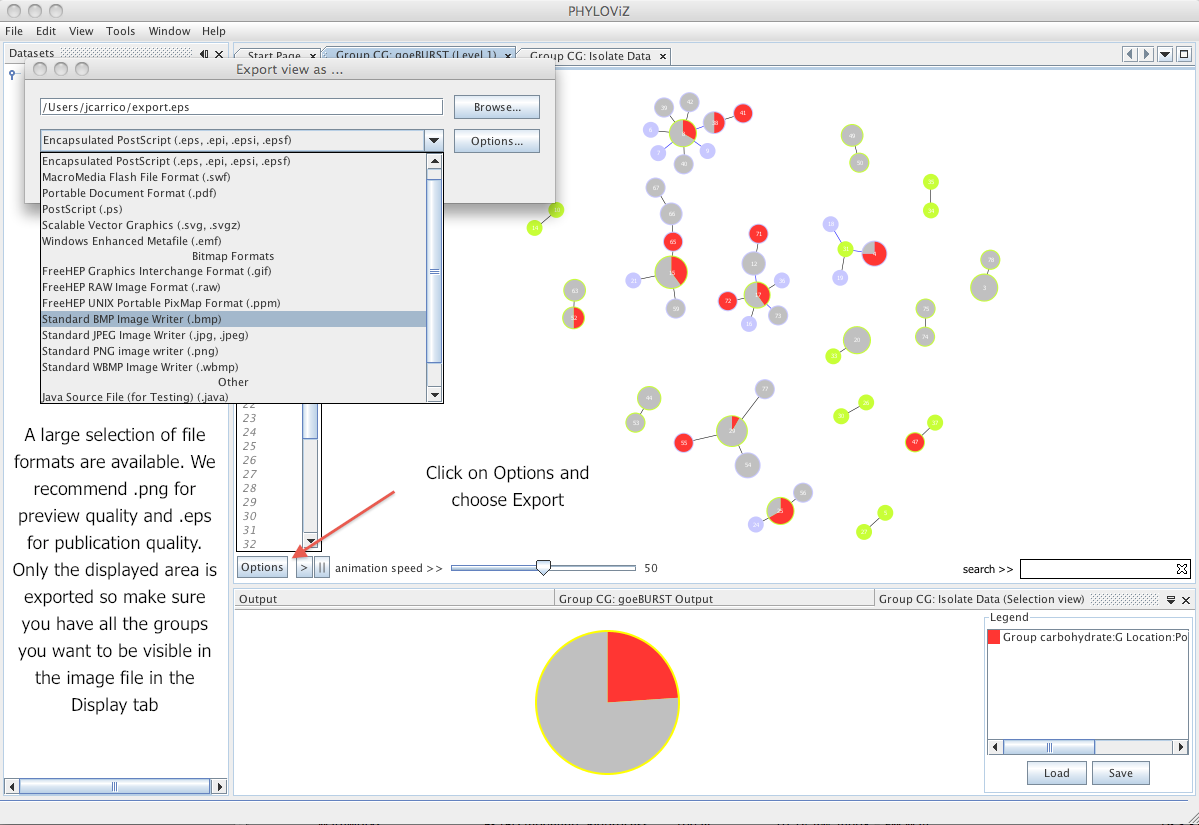
Exporting the results to an image file
To export the resulting graphs to an image file. Click on the Options button and choose Export. Select the adequate file format for the intended purpose. We recommend the use of png images for presentation quality and eps for publication quality.